Visualisation#
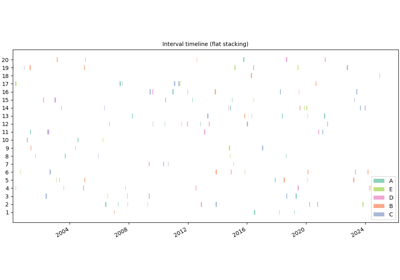
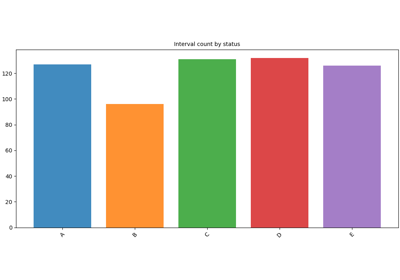
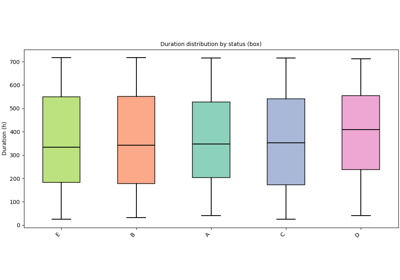
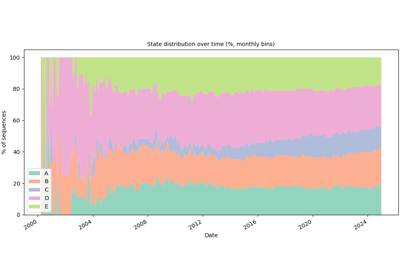
Visualize sequences using SequenceVisualizer.
All visualizations work on both sequence pools and individual sequences.
All visualizers follow the same fluent builder pattern:
SequenceVisualizer.<type>(<params>) \
    .title("...") \
    .colors("Set2") \
    .draw(pool, entity_feature="status") \
    .show()
Style methods#
All builders share the same chainable style methods:
.title(text)→ figure title.figsize(w, h)→ figure dimensions in inches.grid(show=True)→ background grid lines.colors(spec)→ color palette (colormap name, dict, or list).legend(show, location, title)→ legend configuration.marker(alpha, edge_color, ...)→ marker / bar appearance.x_axis(label, rotation, ...)→ horizontal axis.y_axis(show, label, ...)→ vertical axis