Note
Go to the end to download the full example code.
Spanplot#
Visualize segment-duration distributions with
SequenceVisualizer.
Three chart styles and two grouping dimensions are available:
kind:"box"(default),"violin", or"strip"group_by:"category"(one column per label) or"id"(one column per sequence)
Note
Compatible with interval and state pools only.
Event pools have no duration; passing one raises UnsupportedSequenceTypeError.
Imports#
import polars as pl

from tanat import build_intervals
from tanat.dataset import simulate_intervals, simulate_static
from tanat.visualization import SequenceVisualizer
Simulate data#
simulate_intervals() produces one row
per interval. The second feature (status) is categorical; it groups the
duration boxes.
temporal = simulate_intervals(
    n_ids=80,
    seq_length_range=(4, 15),
    features=["value", "status"],
    seed=42,
)
print(temporal.shape, temporal.columns.tolist())
(780, 5) ['id', 'start', 'end', 'value', 'status']
temporal.head()
Build the pool#
pool = build_intervals(
    temporal_data=temporal,
    id_column="id",
    start_column="start",
    end_column="end",
)
┌─ Interval SequenceStore
│
│ Step 1/4: Sorting & preparing data
│
│ Step 2/4: Building sequence index
│
│ Step 3/4: Writing entity & time index features
│
│ Step 4/4: Computing & writing metadata
│
└─ Done (80 sequences · 780 entities · 0.00s)
pool.cast_features({"status": pl.Categorical}, is_static=False)
print(pool)
┌────────────────────────────────────────────────┐
│          IntervalSequencePool Summary          │
└────────────────────────────────────────────────┘

Overview
─────────────────────────
  Sequences          80
  Store              /home/runner/.tanat/_quick_interval_0ac403f4
  id_column          id

Time Index
─────────────────────────
  Type               Datetime(time_unit='us', time_zone=None) [2000-01-05 17:41:31.636713 → 2025-01-19 23:04:04.968485]
  Columns            ['start', 'end']
  t0                 position=0, anchor=start

Entity Features (2)
─────────────────────────
  • status              Categorical (5 categories)
  • value               Numerical [1 → 100]
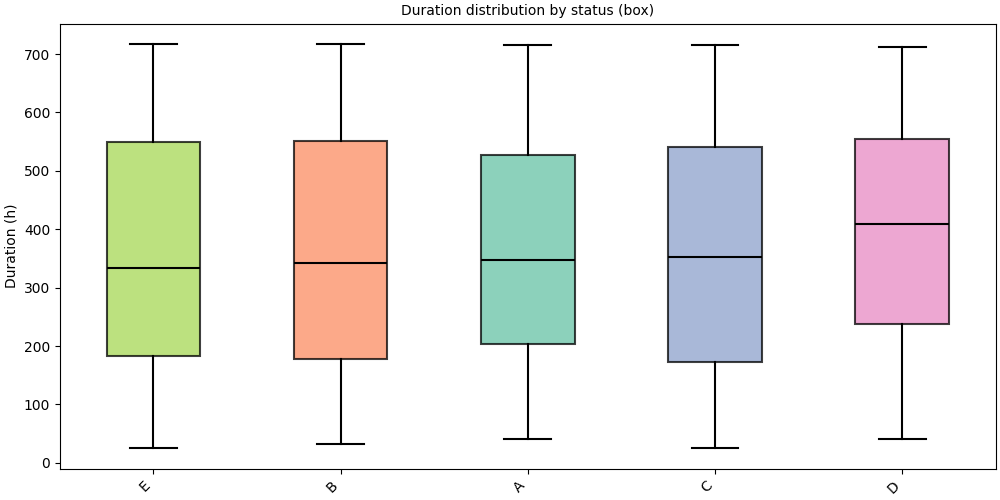
Box plot (default)#
kind="box" (default) renders a standard box-and-whisker plot.
Groups are sorted by ascending median duration.
# fmt: off
SequenceVisualizer.spanplot(kind="box", display_unit="hours") \
    .title("Duration distribution by status (box)") \
    .y_axis(label="Duration (h)") \
    .colors("Set2") \
    .draw(pool, entity_feature="status") \
    .show()
# fmt: on
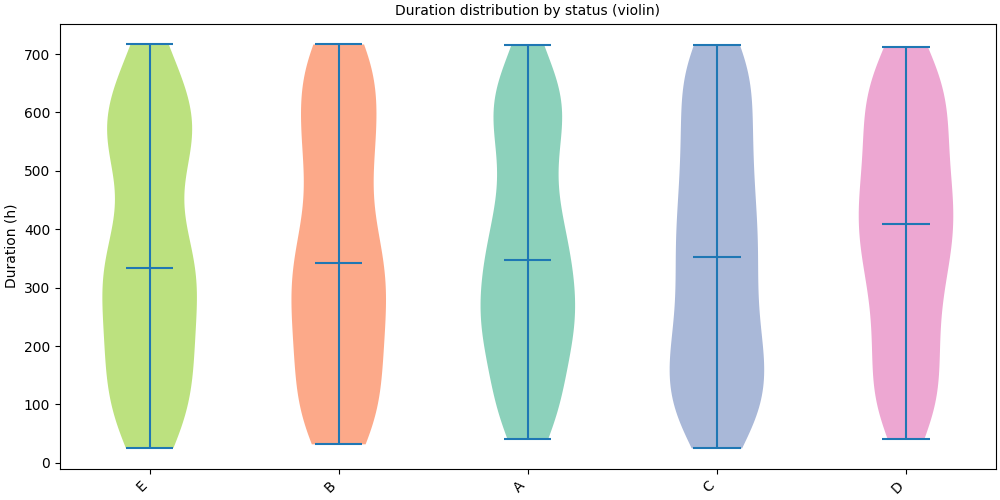
Violin plot#
kind="violin" shows the full kernel-density estimate, more informative
when the distribution is multimodal or skewed.
# fmt: off
SequenceVisualizer.spanplot(kind="violin", display_unit="hours") \
    .title("Duration distribution by status (violin)") \
    .y_axis(label="Duration (h)") \
    .colors("Set2") \
    .draw(pool, entity_feature="status") \
    .show()
# fmt: on
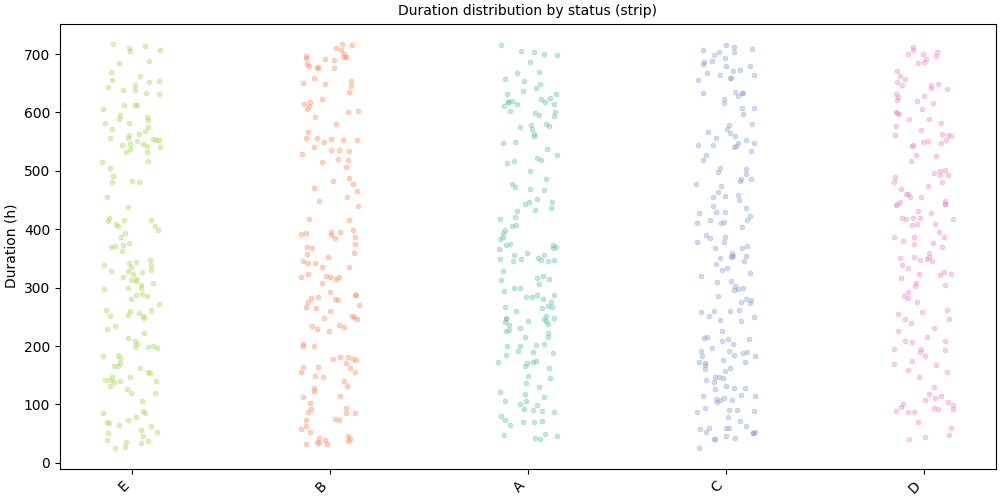
Strip plot#
kind="strip" renders individual points with horizontal jitter,
ideal for spotting outliers and showing raw data density.
# fmt: off
SequenceVisualizer.spanplot(kind="strip", display_unit="hours") \
    .title("Duration distribution by status (strip)") \
    .y_axis(label="Duration (h)") \
    .marker(alpha=0.4, point_size=3.5) \
    .colors("Set2") \
    .draw(pool, entity_feature="status") \
    .show()
# fmt: on
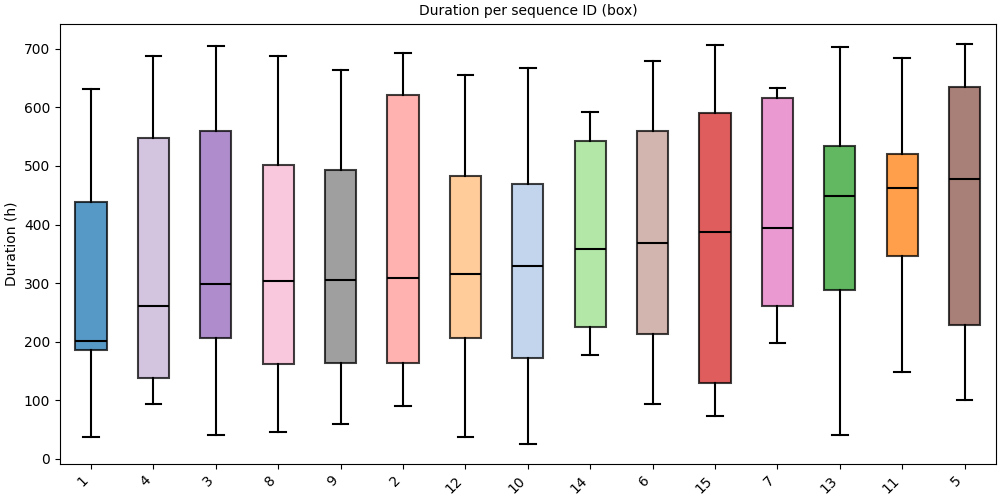
Group by sequence ID#
group_by="id" shows one distribution per sequence ID.
We work on a small subset to keep the chart readable.
small_pool = pool.subset(ids=pool.unique_ids[:15])
# Box: one distribution per ID
# fmt: off
SequenceVisualizer.spanplot(group_by="id", kind="box", display_unit="hours") \
    .title("Duration per sequence ID (box)") \
    .y_axis(label="Duration (h)") \
    .x_axis(rotation=45) \
    .colors("tab20") \
    .draw(small_pool, entity_feature="status") \
    .show()
# fmt: on
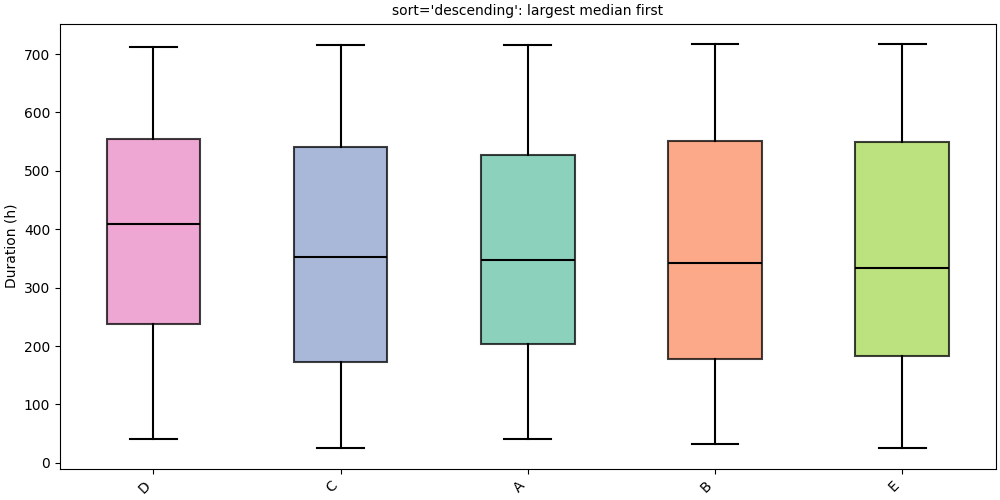
Sort order#
sort controls the group ordering on the x-axis:
"ascending": ascending median duration (default)"descending": descending median duration"alphabetic": alphabetical label order
# Descending: largest median first
# fmt: off
SequenceVisualizer.spanplot(kind="box", display_unit="hours", sort="descending") \
    .title("sort='descending': largest median first") \
    .y_axis(label="Duration (h)") \
    .colors("Set2") \
    .draw(pool, entity_feature="status") \
    .show()
# fmt: on
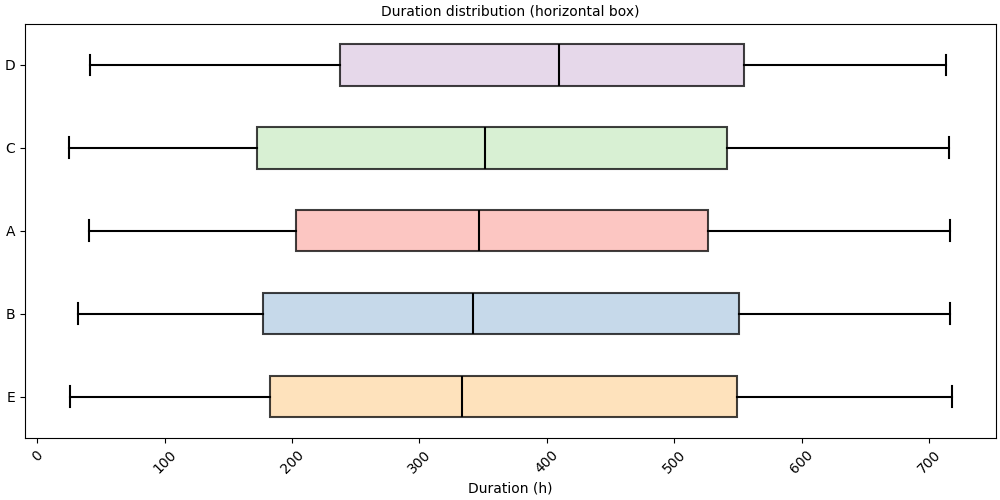
Horizontal orientation#
orientation="horizontal" moves group labels to the y-axis,
especially useful when label names are long.
# fmt: off
SequenceVisualizer.spanplot(
    kind="box",
    display_unit="hours",
    orientation="horizontal",
) \
    .title("Duration distribution (horizontal box)") \
    .x_axis(label="Duration (h)") \
    .colors("Pastel1") \
    .draw(pool, entity_feature="status") \
    .show()
# fmt: on
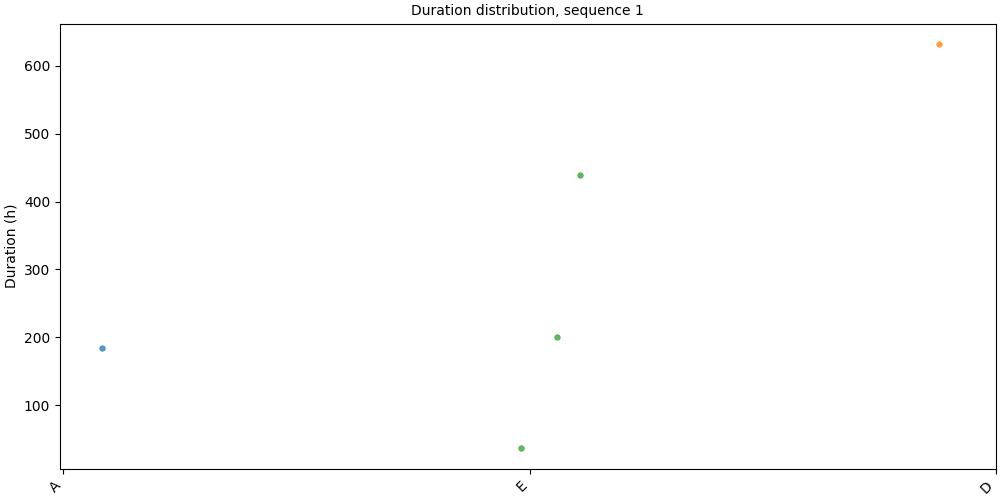
Single sequence#
Pass a Sequence directly for a per-individual view.
seq = pool[pool.unique_ids[0]]
print(f"ID {seq.id_value}: {len(seq)} intervals")
ID 1: 5 intervals
# fmt: off
SequenceVisualizer.spanplot(kind="strip", display_unit="hours") \
    .title(f"Duration distribution, sequence {seq.id_value}") \
    .y_axis(label="Duration (h)") \
    .colors("tab10") \
    .draw(seq, entity_feature="status") \
    .show()
# fmt: on
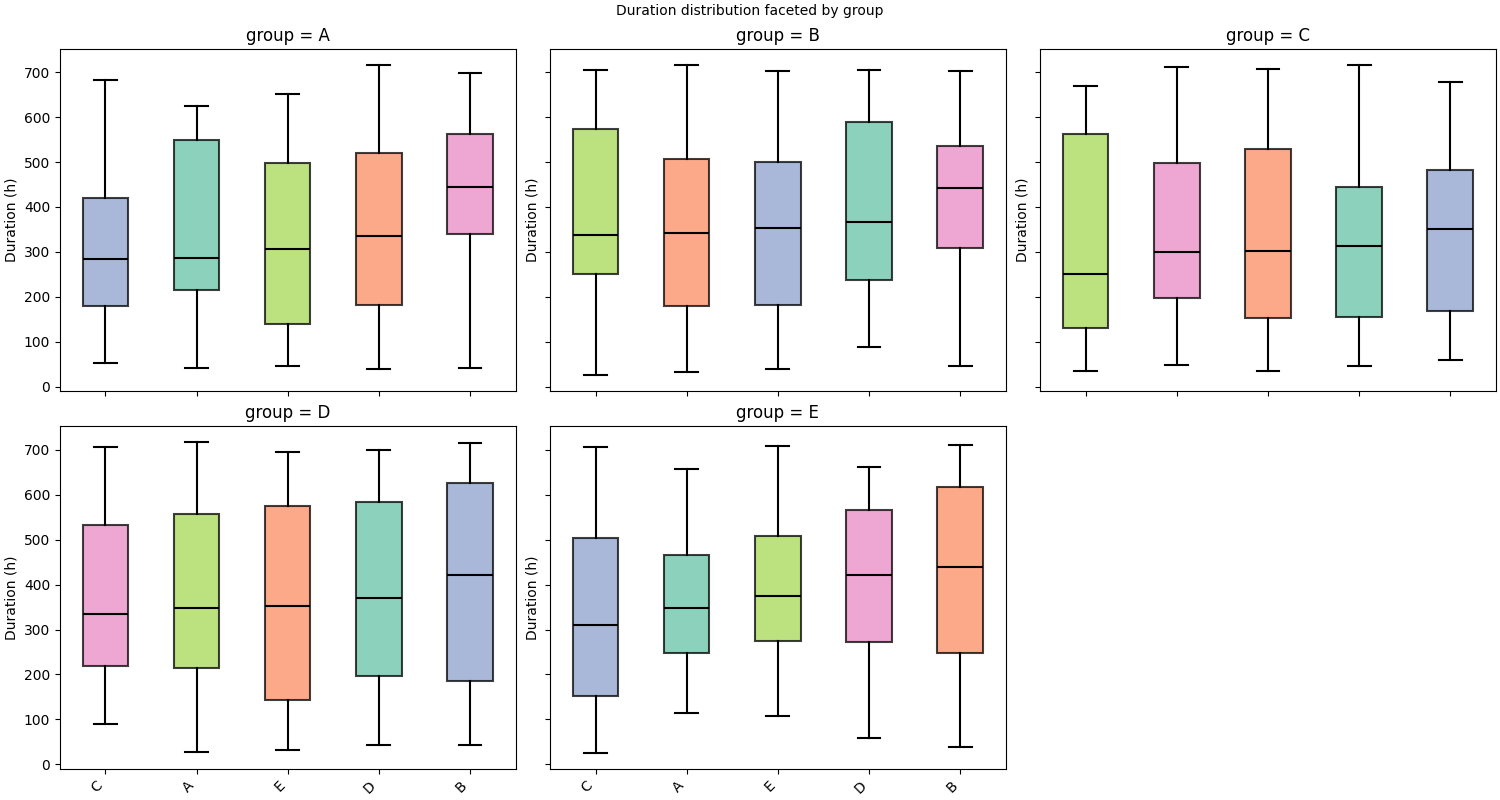
Faceting#
.facet() splits the chart into a grid of panels, one per unique value
of a chosen feature. Here we attach per-sequence static data and facet on
group.
static_df = simulate_static(n_ids=80, features=["age", "group"], seed=0)
pool.add_static_features(static_df)
pool.cast_features({"group": pl.Categorical}, is_static=True)
# fmt: off
SequenceVisualizer.spanplot(kind="box", display_unit="hours") \
    .facet(by="group", is_static=True, cols=3) \
    .title("Duration distribution faceted by group") \
    .y_axis(label="Duration (h)") \
    .colors("Set2") \
    .draw(pool, entity_feature="status") \
    .show()
# fmt: on
Inspect prepare_data()#
prepare_data() returns the flat Polars DataFrame before rendering.
Each row is one segment; __DURATION__ holds the computed duration.
builder = SequenceVisualizer.spanplot(display_unit="hours")
df = builder.prepare_data(pool, entity_feature="status")
df.head()
Total running time of the script: (0 minutes 1.336 seconds)