Note
Go to the end to download the full example code.
Exploring learner activity sequences#
Scenario: You have interaction logs from a Moodle LMS and want to understand how learners engage with course material.
Concepts covered:
Load an event log with
access()Detect learning sessions from inactivity gaps
Build a
StateSequencePoolwithbuild_states()Filter sequences by length with
LengthCriterionVisualise action distributions, timelines, and state distributions
Imports#
import random

import pandas as pd
import polars as pl

from tanat import build_states
from tanat.criterion import LengthCriterion
from tanat.dataset import access
from tanat.visualization import SequenceVisualizer
Load and prepare the event log#
access() returns the MOOC dataset as a pandas
DataFrame. Each row is a single learner interaction recorded by a Moodle
LMS (~100 k events, ~118 learners).
df = access("mooc_events")
print(f"{len(df)} events  ·  {df['user'].nunique()} learners")
df.head()
mooc_events.csv:   0%|          | 0.00/14.6M [00:00<?, ?B/s]
mooc_events.csv:   1%|          | 98.3k/14.6M [00:00<00:15, 964kB/s]
mooc_events.csv:   1%|▏         | 197k/14.6M [00:00<00:14, 961kB/s]
mooc_events.csv:   2%|▏         | 295k/14.6M [00:00<00:14, 968kB/s]
mooc_events.csv:   3%|▎         | 393k/14.6M [00:00<00:14, 972kB/s]
mooc_events.csv:   3%|▎         | 492k/14.6M [00:00<00:14, 969kB/s]
mooc_events.csv:   4%|▍         | 590k/14.6M [00:00<00:14, 970kB/s]
mooc_events.csv:   5%|▍         | 688k/14.6M [00:00<00:14, 974kB/s]
mooc_events.csv:   5%|▌         | 786k/14.6M [00:00<00:14, 969kB/s]
mooc_events.csv:   6%|▌         | 885k/14.6M [00:00<00:14, 971kB/s]
mooc_events.csv:   7%|▋         | 983k/14.6M [00:01<00:14, 968kB/s]
mooc_events.csv:   7%|▋         | 1.08M/14.6M [00:01<00:13, 969kB/s]
mooc_events.csv:   9%|▉         | 1.28M/14.6M [00:01<00:13, 987kB/s]
mooc_events.csv:  10%|█         | 1.52M/14.6M [00:01<00:11, 1.10MB/s]
mooc_events.csv:  12%|█▏        | 1.75M/14.6M [00:01<00:11, 1.13MB/s]
mooc_events.csv:  13%|█▎        | 1.95M/14.6M [00:01<00:11, 1.09MB/s]
mooc_events.csv:  15%|█▍        | 2.13M/14.6M [00:02<00:12, 1.03MB/s]
mooc_events.csv:  16%|█▌        | 2.34M/14.6M [00:02<00:11, 1.05MB/s]
mooc_events.csv:  17%|█▋        | 2.52M/14.6M [00:02<00:11, 1.01MB/s]
mooc_events.csv:  19%|█▉        | 2.77M/14.6M [00:02<00:10, 1.09MB/s]
mooc_events.csv:  20%|██        | 2.97M/14.6M [00:02<00:10, 1.06MB/s]
mooc_events.csv:  22%|██▏       | 3.16M/14.6M [00:02<00:09, 1.23MB/s]
mooc_events.csv:  23%|██▎       | 3.30M/14.6M [00:03<00:10, 1.06MB/s]
mooc_events.csv:  24%|██▍       | 3.51M/14.6M [00:03<00:10, 1.05MB/s]
mooc_events.csv:  25%|██▌       | 3.69M/14.6M [00:03<00:10, 1.01MB/s]
mooc_events.csv:  27%|██▋       | 4.01M/14.6M [00:03<00:08, 1.21MB/s]
mooc_events.csv:  29%|██▉       | 4.20M/14.6M [00:03<00:09, 1.15MB/s]
mooc_events.csv:  30%|██▉       | 4.33M/14.6M [00:04<00:08, 1.16MB/s]
mooc_events.csv:  31%|███       | 4.46M/14.6M [00:04<00:08, 1.20MB/s]
mooc_events.csv:  32%|███▏      | 4.60M/14.6M [00:04<00:08, 1.22MB/s]
mooc_events.csv:  33%|███▎      | 4.74M/14.6M [00:04<00:07, 1.28MB/s]
mooc_events.csv:  34%|███▎      | 4.91M/14.6M [00:04<00:07, 1.37MB/s]
mooc_events.csv:  35%|███▍      | 5.05M/14.6M [00:04<00:06, 1.39MB/s]
mooc_events.csv:  36%|███▌      | 5.23M/14.6M [00:04<00:07, 1.18MB/s]
mooc_events.csv:  37%|███▋      | 5.37M/14.6M [00:04<00:07, 1.20MB/s]
mooc_events.csv:  38%|███▊      | 5.55M/14.6M [00:05<00:08, 1.08MB/s]
mooc_events.csv:  39%|███▉      | 5.67M/14.6M [00:05<00:08, 1.11MB/s]
mooc_events.csv:  40%|███▉      | 5.79M/14.6M [00:05<00:07, 1.13MB/s]
mooc_events.csv:  41%|████      | 5.91M/14.6M [00:05<00:07, 1.15MB/s]
mooc_events.csv:  41%|████▏     | 6.04M/14.6M [00:05<00:07, 1.17MB/s]
mooc_events.csv:  42%|████▏     | 6.16M/14.6M [00:05<00:07, 1.19MB/s]
mooc_events.csv:  43%|████▎     | 6.28M/14.6M [00:05<00:06, 1.20MB/s]
mooc_events.csv:  44%|████▍     | 6.41M/14.6M [00:05<00:06, 1.20MB/s]
mooc_events.csv:  45%|████▍     | 6.53M/14.6M [00:05<00:06, 1.21MB/s]
mooc_events.csv:  46%|████▌     | 6.65M/14.6M [00:06<00:08, 927kB/s]
mooc_events.csv:  47%|████▋     | 6.85M/14.6M [00:06<00:06, 1.18MB/s]
mooc_events.csv:  48%|████▊     | 7.00M/14.6M [00:06<00:07, 1.02MB/s]
mooc_events.csv:  49%|████▉     | 7.13M/14.6M [00:06<00:07, 1.06MB/s]
mooc_events.csv:  50%|█████     | 7.32M/14.6M [00:06<00:07, 1.01MB/s]
mooc_events.csv:  52%|█████▏    | 7.54M/14.6M [00:06<00:06, 1.06MB/s]
mooc_events.csv:  53%|█████▎    | 7.66M/14.6M [00:06<00:06, 1.08MB/s]
mooc_events.csv:  53%|█████▎    | 7.77M/14.6M [00:07<00:06, 1.09MB/s]
mooc_events.csv:  54%|█████▍    | 7.89M/14.6M [00:07<00:06, 1.10MB/s]
mooc_events.csv:  56%|█████▌    | 8.16M/14.6M [00:07<00:05, 1.21MB/s]
mooc_events.csv:  58%|█████▊    | 8.39M/14.6M [00:07<00:05, 1.19MB/s]
mooc_events.csv:  60%|██████    | 8.80M/14.6M [00:07<00:03, 1.50MB/s]
mooc_events.csv:  62%|██████▏   | 8.99M/14.6M [00:07<00:04, 1.34MB/s]
mooc_events.csv:  63%|██████▎   | 9.24M/14.6M [00:08<00:04, 1.31MB/s]
mooc_events.csv:  65%|██████▌   | 9.52M/14.6M [00:08<00:03, 1.35MB/s]
mooc_events.csv:  67%|██████▋   | 9.75M/14.6M [00:08<00:03, 1.29MB/s]
mooc_events.csv:  68%|██████▊   | 9.98M/14.6M [00:08<00:03, 1.25MB/s]
mooc_events.csv:  70%|███████   | 10.3M/14.6M [00:08<00:03, 1.33MB/s]
mooc_events.csv:  72%|███████▏  | 10.6M/14.6M [00:09<00:02, 1.36MB/s]
mooc_events.csv:  75%|███████▍  | 10.9M/14.6M [00:09<00:02, 1.46MB/s]
mooc_events.csv:  76%|███████▌  | 11.1M/14.6M [00:09<00:02, 1.51MB/s]
mooc_events.csv:  78%|███████▊  | 11.4M/14.6M [00:09<00:02, 1.53MB/s]
mooc_events.csv:  81%|████████  | 11.8M/14.6M [00:09<00:01, 2.11MB/s]
mooc_events.csv:  85%|████████▍ | 12.3M/14.6M [00:09<00:00, 2.71MB/s]
mooc_events.csv:  87%|████████▋ | 12.6M/14.6M [00:09<00:00, 2.66MB/s]
mooc_events.csv:  89%|████████▉ | 13.0M/14.6M [00:10<00:00, 2.84MB/s]
mooc_events.csv:  93%|█████████▎| 13.5M/14.6M [00:10<00:00, 3.51MB/s]
mooc_events.csv:  98%|█████████▊| 14.3M/14.6M [00:10<00:00, 4.53MB/s]
mooc_events.csv: 100%|██████████| 14.6M/14.6M [00:10<00:00, 1.42MB/s]
95626 events  ·  130 learners
Step 1: Session detection#
Learning sessions are not labelled in the log. We define a session as a continuous period of activity: a new session begins when the same learner is idle for more than 2 hours, or when a different user appears.
Each session receives a unique integer id that will serve as the sequence identifier in TanaT.
INACTIVITY = pd.Timedelta("2h")

df["timecreated"] = pd.to_datetime(df["timecreated"])
df = df.sort_values(["user", "timecreated"])
df["session"] = (
    (df["user"] != df["user"].shift()) | (df["timecreated"].diff() > INACTIVITY)
).cumsum()

print(f"Detected {df['session'].nunique()} sessions")
Detected 5700 sessions
Static table: one row per session with the learner identifier.
sessions = df[["user", "session"]].drop_duplicates()
Step 2: Build the sequence pool#
Each session becomes one sequence. We use
build_states() with a within-session position index
as the time axis (0 = first event, 1 = second, …). This abstracts away
calendar time and focuses on the order of actions.
The sessions table (one row per session) is passed as static_data
so the learner identifier is attached to each sequence.
# Add a within-session position index.
df["position"] = df.groupby("session").cumcount()

pool = build_states(
    df[["session", "position", "Action"]],
    id_column="session",
    start_column="position",
    static_data=sessions,
    store_name="mooc_sessions_store",
)
# ``pl.Categorical`` enables consistent colour-coding across visualisations
# and is required by the metric module.
pool.cast_features({"Action": pl.Categorical}, is_static=False)
┌─ State SequenceStore
│
│ Step 1/4: Sorting & preparing data
│
│ Step 2/4: Building sequence index
│
│ Step 3/4: Writing entity, time index & static features
│
│ Step 4/4: Computing & writing metadata
│
└─ Done (5,700 sequences · 95,626 entities · 0.02s)
print(pool)
┌────────────────────────────────────────────────┐
│           StateSequencePool Summary            │
└────────────────────────────────────────────────┘

Overview
─────────────────────────
  Sequences          5,700
  Store              /home/runner/.tanat_workspace/building_pools_tutorial/mooc_sessions_store
  id_column          session

Time Index
─────────────────────────
  Type               Int64 (Timestep) [0 → 152]
  Columns            ['position', 'end']
  t0                 position=0, anchor=start

Entity Features (1)
─────────────────────────
  • Action              Categorical (12 categories)

Static Features (1)
─────────────────────────
  • user                String [len 9 → 9]
Step 3: Filter by length#
The session length distribution is skewed: some outlier sessions contain hundreds of events. We keep sessions with 2 to 40 actions, which covers the majority of learners while removing single-click noise and unrealistically long sessions.
ids_keep = pool.which(LengthCriterion(ge=2, le=40))
pool_filtered = pool.subset(ids_keep)
[which] LengthCriterion → 5,150 / 5,700 IDs (90.4%)
print(pool_filtered)
┌────────────────────────────────────────────────┐
│           StateSequencePool Summary            │
└────────────────────────────────────────────────┘

Overview
─────────────────────────
  Sequences          5,150
  Store              /home/runner/.tanat_workspace/building_pools_tutorial/mooc_sessions_store
  id_column          session

Time Index
─────────────────────────
  Type               Int64 (Timestep) [0 → 39]
  Columns            ['position', 'end']
  t0                 position=0, anchor=start

Entity Features (1)
─────────────────────────
  • Action              Categorical (12 categories)

Static Features (1)
─────────────────────────
  • user                String [len 9 → 9]
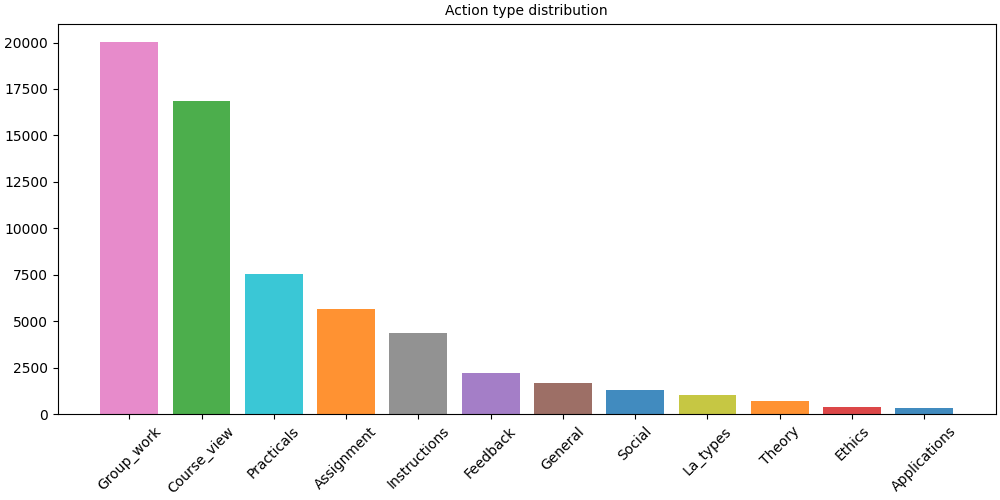
Step 4: Action distribution#
A bar plot shows the frequency of each action type across all sessions, giving a first overview of what learners do most.
# fmt: off
SequenceVisualizer.barplot(sort="descending") \
    .title("Action type distribution") \
    .draw(pool_filtered, entity_feature="Action") \
    .show()
# fmt: on
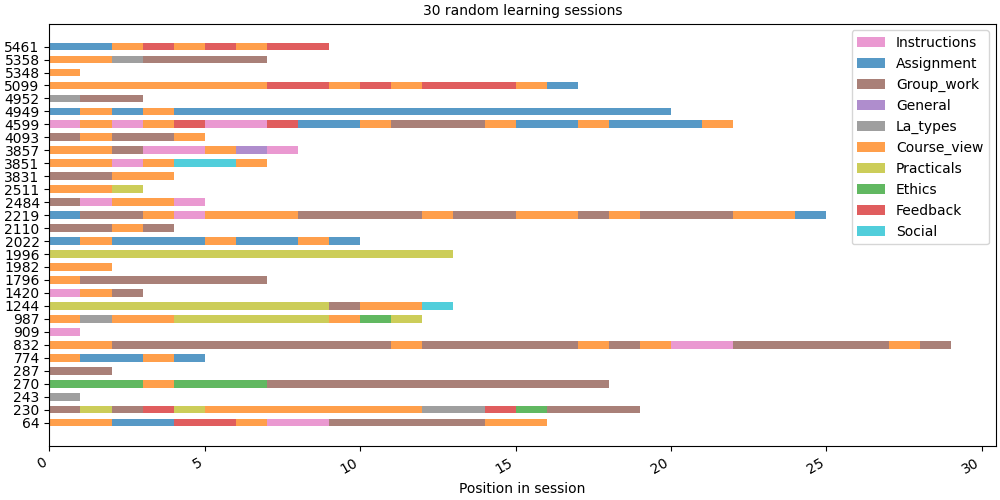
Step 5: Sample timeline#
We draw 30 random sessions side by side. Each row is one session; each coloured block is one action at a given position.
random.seed(42)
sample_ids = random.sample(sorted(pool_filtered.unique_ids), 30)
sample = pool_filtered.subset(sample_ids)

# fmt: off
SequenceVisualizer.timeline() \
    .title("30 random learning sessions") \
    .x_axis(label="Position in session") \
    .draw(sample, entity_feature="Action") \
    .show()
# fmt: on
/opt/hostedtoolcache/Python/3.13.14/x64/lib/python3.13/site-packages/tanat_utils/caching/cachable.py:133: UserWarning: 30 row(s) have a null time index (__END__) and will be excluded from the visualisation.
  value = method(self, *args, **kwargs)
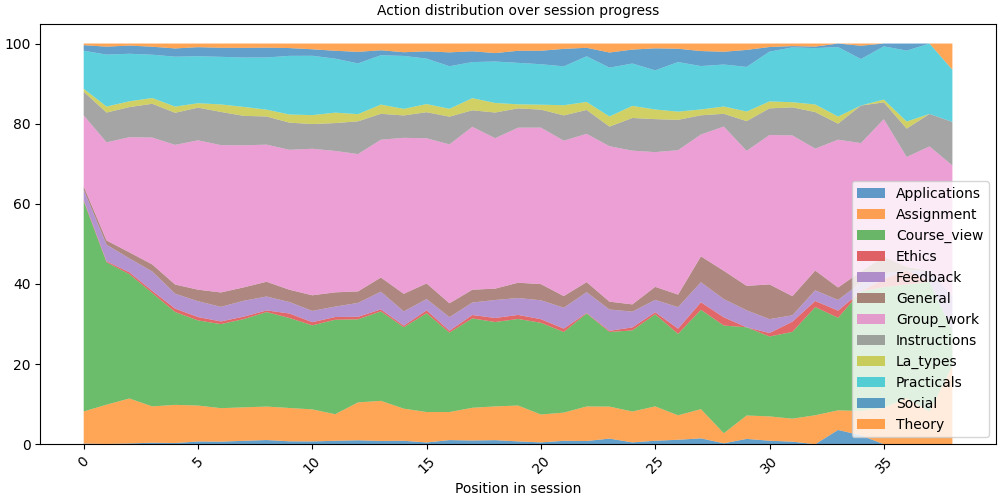
Step 6: State distribution over position#
The distribution plot shows how action proportions shift across positions, revealing how learners typically start and end their sessions.
# fmt: off
SequenceVisualizer.distribution(bin_size=1) \
    .title("Action distribution over session progress") \
    .x_axis(label="Position in session") \
    .draw(pool_filtered, entity_feature="Action") \
    .show()
# fmt: on
/opt/hostedtoolcache/Python/3.13.14/x64/lib/python3.13/site-packages/tanat_utils/caching/cachable.py:133: UserWarning: 5150 row(s) have a null time index (__END__) and will be excluded from the visualisation.
  value = method(self, *args, **kwargs)
Total running time of the script: (0 minutes 12.542 seconds)